

You're watching a video, compiling a project, or just returning to a machine that appeared stable. The cursor freezes, the screen turns blue, and Windows displays MEMORY_MANAGEMENT with the stop code 0x0000001A. The instinctive response is often to order new RAM, but that's a costly guess, not a diagnosis.
A blue screen memory management failure can involve physical memory, but it can also come from a graphics, chipset, storage, antivirus, or VPN driver, unstable BIOS settings, or a Windows update. The fastest path is to treat the crash dump as evidence, test the configuration that evidence points toward, and replace hardware only when the results justify it.
What the Blue Screen Memory Management Error Actually Means
The 0x0000001A identifier is Microsoft's documented bug check for MEMORY_MANAGEMENT, a severe memory-management failure in the Windows kernel. Microsoft's bug-check documentation has been publicly maintained since at least April 6, 2023, and was updated on January 29, 2026, so this isn't an obsolete blue-screen category. The current reference is Microsoft's MEMORY_MANAGEMENT bug-check documentation.
In practical terms, Windows has detected that something involving memory bookkeeping or access can't be trusted. The failing operation may involve corrupted memory structures, an invalid address, a damaged pool allocation, or a kernel component that supplied bad information. The Memory Manager stops the system because continuing could corrupt files, processes, or the operating system itself.
Practical rule: The stop code identifies the failure category, not automatically the defective part.
That distinction matters. A bad DIMM can corrupt data and trigger the code, but so can a driver that writes beyond an allocated region. A graphics driver may mishandle memory used by the display stack. A storage or security filter may damage kernel state. Firmware can also make an otherwise healthy memory kit unstable through an aggressive profile or poor training result.
MEMORY_MANAGEMENT also shouldn't be treated as interchangeable with every memory-related stop code. IRQL_NOT_LESS_OR_EQUAL generally points toward an invalid access at an inappropriate interrupt request level, while PAGE_FAULT_IN_NONPAGED_AREA concerns an invalid reference to memory that should remain resident. Those categories overlap in possible causes, but their dump evidence and suspect lists can differ.
A crash during video playback, a long compile, or a game load may suggest a component under sustained activity, but the timing alone doesn't prove that component is defective. An idle crash can be just as revealing, particularly when power-state transitions or memory training expose instability.
The dump is your starting point. Before opening the case or buying a replacement kit, establish whether Windows recorded a recognizable third-party module, a graphics or storage path, or only an inconclusive kernel state. A useful visual reference for the familiar crash screen is this Blue Screen Simulator Plus resource, but the diagnostic value sits in the dump files.
Common Causes Behind MEMORY_MANAGEMENT BSODs
The same stop code can arise from very different failure paths. Start with the symptom pattern, then confirm it with dump analysis and controlled testing.
Driver faults often wear a hardware disguise
Third-party kernel drivers deserve early attention. Antivirus filters, VPN clients, storage utilities, graphics tools, and motherboard management software all operate close to the memory manager. A defective update can mishandle an allocation, a buffer, or a device-memory operation and leave Windows reporting MEMORY_MANAGEMENT even though the DIMMs are sound.
A crash that begins after installing a vendor update is a strong reason to roll that component back or perform a clean reinstall. Repeated crashes during graphics activity point toward the display stack, while failures during file transfers, sleep transitions, or disk-heavy work make storage and chipset components more interesting.
BIOS settings can turn stable hardware into unstable hardware
XMP and EXPO profiles change memory speed, timings, and voltage. They're useful performance settings, but they're still an overclock-like operating condition, and the integrated memory controller, motherboard firmware, and DIMMs must all train successfully together. Optimized motherboard presets can also apply settings that appear automatic while operating outside the most conservative baseline.
Fresh Windows installations on new PCs are especially deceptive. The operating system may be blamed because crashes appear soon after setup, while the trigger is a BIOS profile, memory training behavior, or a firmware interaction. Returning to motherboard defaults is a diagnostic action, not an admission that the hardware is bad.
Windows updates can expose existing driver problems
A cumulative update or servicing change can alter timing, kernel behavior, or driver interactions. That doesn't necessarily mean the update directly damaged memory. It may have exposed a pre-existing driver defect that had remained dormant under the previous system state.
Review the update history against the first crash. If the timing lines up, uninstalling the latest update can be a useful test, provided you understand the security trade-off and reinstall a corrected update when available.
Physical RAM remains a real possibility
Faulty DIMMs, poor contacts, damaged slots, incompatible module combinations, and memory-controller limits can all produce genuine corruption. The pattern matters. Errors that follow one module between slots implicate the module more strongly. Errors that remain tied to one slot suggest the board or socket. Crashes that occur only with multiple modules installed point toward training, timings, or controller stability rather than automatically proving a defective stick.
| Cause | Typical symptom pattern | First evidence to check |
| Third-party driver | Crash after a driver update or during a related workload | Minidump module and stack |
| BIOS, XMP, or EXPO instability | Crashes after configuration changes, during load, or at idle | BIOS defaults and profile state |
| Windows update interaction | Failure begins after servicing activity | Update history and dump timing |
| Physical memory or slot fault | Errors follow a module or slot across tests | MemTest86 results and single-stick testing |
The useful question isn't “Which part is famous for causing this?” It's “Which cause best matches the evidence collected from this machine?”
Reading the Crash Dump Before You Touch Hardware
Start with the latest file in C:\Windows\Minidump. Microsoft support guidance favors minidumps for first-pass work because they're faster to upload and download than a full memory image. Check C:\Windows\MEMORY.DMP only when no usable minidump exists, then open the selected file in WinDbg.
Set the symbol path before interpreting the output. In WinDbg, use:
` .sympath srvC:\Symbols
Then reload symbols and run the verbose analysis command:
.reload
!analyze -v
The leading space shown above is not required in WinDbg. What matters is that symbols load correctly and the analysis isn't being read from an incomplete symbol state.
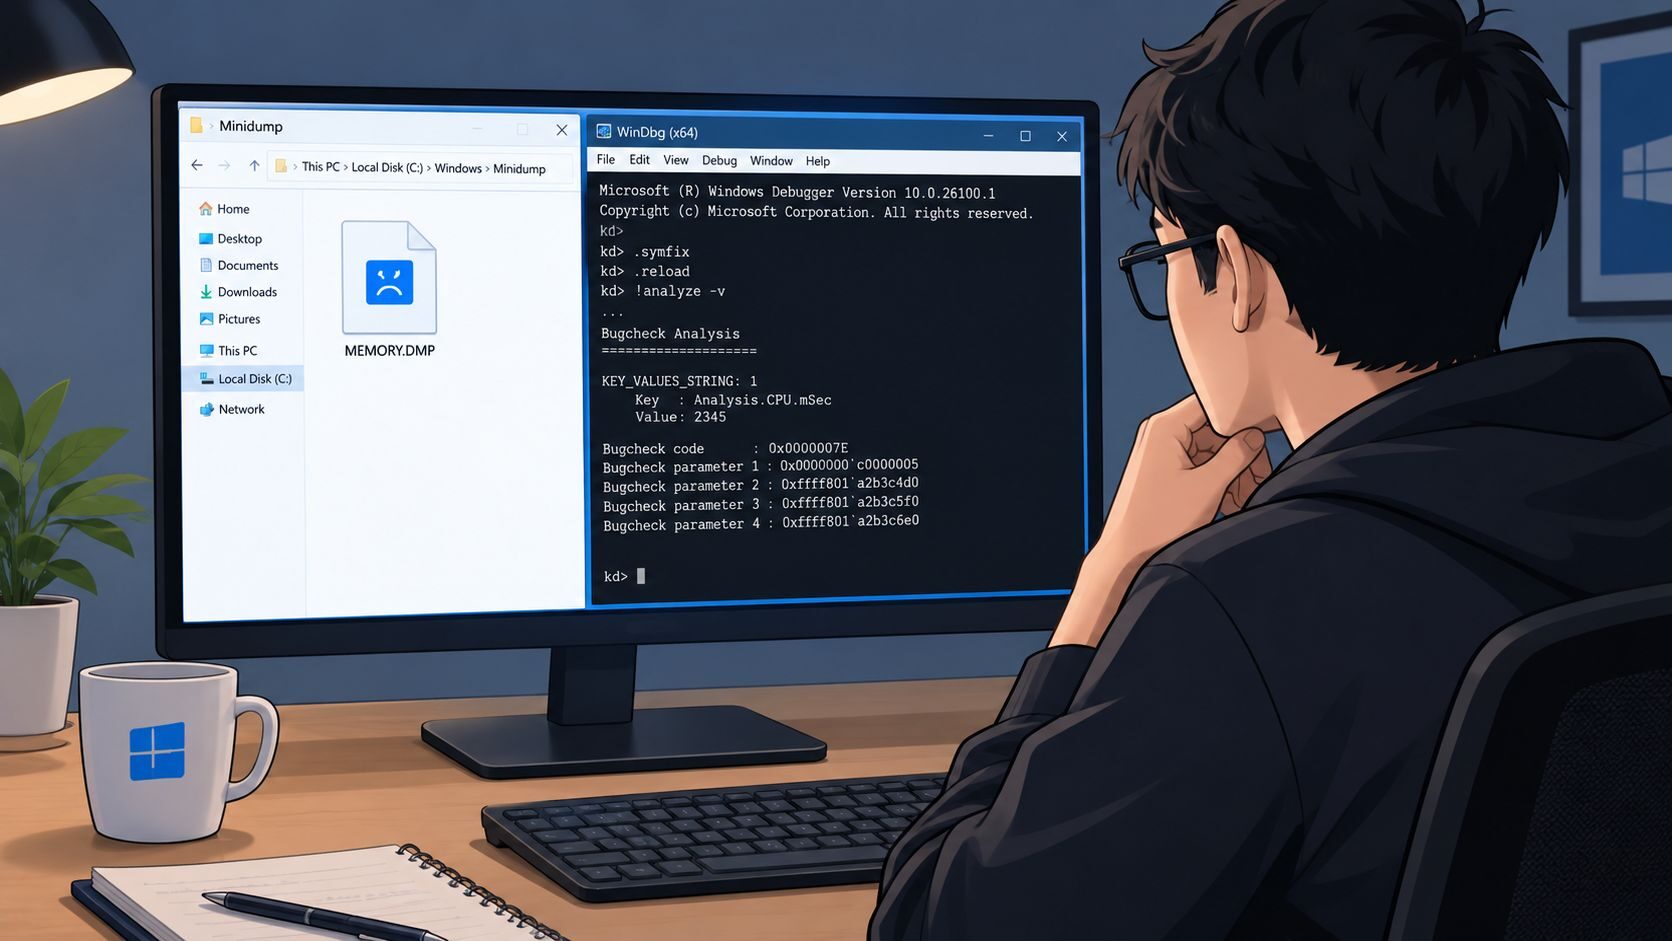
Read the named module, then read the stack
Focus first on MODULE_NAME, IMAGE_NAME, and the stack frames. The module name tells you which image WinDbg associates with the failure. The image name gives the file, such as a named third-party driver. The stack shows the path that led to the stop, which can reveal a driver calling into a failing kernel routine.
You may see ntoskrnl.exe, the Windows kernel, named as the image. That doesn't mean the kernel is defective. Windows often detects the corruption inside its own allocator after another component has already caused it. A corrupted pool header, for example, can identify the allocator as the place where damage was noticed rather than the caller that caused it.
Use k or kd to inspect the stack when the default output needs more context. A clean, vendor-named trace gives you a defensible next action. A stack that contains only generic kernel routines is less conclusive and should move you toward configuration checks and physical-memory testing rather than a confident hardware verdict.
The Sysinternals Suite guide can also help with broader Windows investigation, but it shouldn't replace WinDbg when you need to interpret a kernel crash. Record the driver version and timestamp, then compare them with Windows Update history and recent software installations. That correlation often separates a newly introduced driver fault from a long-standing hardware problem.
Why It Is Rarely Just Bad RAM
“Bad RAM” is a reasonable hypothesis, but it's a poor default conclusion. The stop code says Windows found a serious memory-management failure. It doesn't say which component first corrupted the state.
A third-party graphics, antivirus, VPN, storage, or chipset driver can cause the kernel to report a memory failure after the original mistake has already happened. BIOS and XMP or EXPO instability can produce the same visible symptom, especially when the machine is stable with conservative defaults but fails with a performance profile enabled. A Windows update can also expose a driver defect that was previously quiet.
That's why replacing RAM before reading the dump often fails. A new kit may behave differently, but it may not change the faulty driver, firmware setting, or update interaction that caused the crash. If the dump names a vendor driver and the crash disappears after a clean rollback, the evidence is stronger than a purchase based solely on the stop-code text.
| Common assumption | What the dump actually shows |
| MEMORY_MANAGEMENT always means defective RAM | The dump may identify a third-party driver or show only delayed kernel detection |
| ntoskrnl.exe proves Windows is broken | The kernel may be where corruption was discovered, not where it began |
| A clean short memory test clears the whole system | A brief test can miss intermittent faults or configuration instability |
| A new memory kit is the fastest fix | The crash can persist if the driver, BIOS profile, or update remains unchanged |
| A crash during gaming proves the GPU is bad | Graphics activity may expose a driver or allocation problem without proving hardware failure |
Modern troubleshooting is moving toward quicker post-crash investigation rather than one-size-fits-all RAM replacement. Microsoft-facing guidance continues to emphasize dumps, drivers, updates, and configuration checks, while Windows 11 has been reported as testing automatic memory-scan prompts after a blue screen in PCMag's coverage of the feature. The direction is sensible: test the likely cause, not the most memorable label.
Testing Physical Memory the Right Way
Once the dump is inconclusive, or after software and firmware causes have been controlled, test the memory properly. Use MemTest86, not only Windows Memory Diagnostic. MemTest86 boots independently of Windows, so it can exercise memory without the operating system, drivers, and background services competing for the same resources.
Before testing, disable XMP or EXPO and load conservative BIOS defaults. Otherwise, a failing test may prove only that the selected profile isn't stable on that configuration. You're trying to isolate the DIMMs and memory path, not validate an overclock.
Use a controlled test matrix
Remove the variables that make results ambiguous:
- Test each module separately: Install one stick at a time in the motherboard's recommended single-module slot.
- Run multiple full passes: Microsoft Q&A guidance includes a recommendation for at least 8 full passes for a near-conclusive result, while another support answer recommends 4 passes as a baseline. See the MemTest86 multi-pass guidance discussed by Microsoft support.
- Record the failing condition: Note the module, slot, test pattern, and whether errors repeat.
- Restore the pair only afterward: If each stick passes alone, test the pair together at conservative defaults, then investigate profile stability separately.
Any reproducible error is significant. Move the same module to another slot to see whether the error follows the stick. If both modules pass alone but fail together, examine BIOS updates, memory training, timings, and the integrated memory controller before declaring both DIMMs defective.
A clean run provides useful evidence that the tested address and data patterns didn't produce errors under that test condition. It doesn't prove that voltage won't droop during a demanding workload, that the controller is stable with a performance profile, or that heat and power transitions can't trigger an intermittent problem. For a broader, practical perspective on hardware health checks in Sheffield, consult the Steel City IT diagnostic resource, then apply the same controlled-testing discipline to your own system.
Fixes That Resolve Most MEMORY_MANAGEMENT Crashes
Begin with the least disruptive action that matches the evidence. If WinDbg names a graphics, chipset, storage, antivirus, or VPN driver, roll back that component first. Use Device Manager where appropriate, or the manufacturer's clean-install option for graphics software. If the driver was partially removed or layered over an older package, a clean removal utility such as Display Driver Uninstaller guidance can reduce leftover driver interference.
Then return the BIOS to default settings and disable XMP or EXPO. Don't combine this with several unrelated changes. The value comes from changing one likely cause and observing whether the crash returns.

Repair Windows only after checking the surrounding software
Review recent Windows updates and uninstall the latest cumulative update if the crashes began immediately afterward. Treat that as a diagnostic rollback, not a permanent security strategy. Run the built-in servicing repairs from an administrator Command Prompt:
DISM /Online /Cleanup-Image /RestoreHealth
sfc /scannow
These commands can repair damaged Windows components, but they won't fix a defective DIMM or an unstable memory profile. They also won't turn an incorrectly identified driver into a healthy one.
Pagefile changes should be conservative. Windows normally manages the pagefile well, and changing it rarely fixes the original cause of a MEMORY_MANAGEMENT crash. Don't force a custom size or move it to another drive as a reflex. First verify dump settings, free storage, and disk health. Clearing a pagefile can remove useful forensic state and make later diagnosis harder.
Memory Integrity and Core Isolation should be adjusted only when a specific incompatible driver points in that direction, and only with a clear understanding of the security trade-off. They're not general-purpose fixes.
Finally, reseat the DIMMs and perform the single-stick swap test. If one module or slot consistently fails while the rest of the configuration passes, hardware replacement becomes justified. Every change should answer a question. If it doesn't, it's troubleshooting by superstition.
Your Triage Checklist and Next Steps
Use one mental model: dump, identify, change one cause, verify stability. The stop code tells you which failure category to investigate. The minidump tells you whether Windows recorded a useful suspect. Your next action should follow that evidence rather than the label alone.
Keep this checklist beside the affected machine:
- Locate the evidence: Save the newest file from C:\Windows\Minidump. Use C:\Windows\MEMORY.DMP only when a minidump isn't available.
- Analyze the dump: Open it in WinDbg, load symbols, run !analyze -v, and inspect MODULE_NAME, IMAGE_NAME, and the stack.
- Identify the faulting path: Separate a named third-party driver from generic kernel routines such as ntoskrnl.exe.
- Apply one targeted fix: Roll back the implicated driver, remove a recent update, or restore BIOS defaults according to the evidence.
- Verify stability: Reproduce the workload that previously crashed, then test physical memory if the result remains inconclusive.

A named third-party driver gives you the clearest handoff. Record its version, roll it back or clean-install a known-good release, and monitor the same workload. If the dump points only to ntoskrnl.exe, storport.sys, or another Windows component, don't accuse that file immediately. Check storage drivers, firmware, updates, BIOS defaults, and the memory configuration before escalating to hardware testing.
An inconclusive stack is where MemTest86 becomes valuable. Disable XMP or EXPO, test modules independently, and compare results across slots. Errors that follow a stick support replacement. Errors tied to a slot support board or contact investigation. A clean test with continued crashes sends you back to drivers, firmware, update history, and workload-specific diagnostics.
For readers who prefer a visual reminder of the process, this video can supplement the written runbook:
The practical outcome isn't merely getting Windows to boot again. It's knowing why the machine crashed and whether the fix addresses the cause or only hides the symptom.
NeoTeo publishes practical technology guides and troubleshooting coverage that can help you investigate Windows crashes, hardware behavior, and PC configuration issues without guesswork. Visit NeoTeo for more tutorials, tools, and analysis to support your next diagnostic session.


