
With the five programs to graph the response time of a ping, you can ping an IP address and thus record the response time plotted on a graph. The advantage of the platforms we will cite is the ability to perform multiple pings to different IP addresses or domains.
The unit used to calculate the response time is milliseconds (ms). It is one of the most reliable units for analyzing connectivity between servers.
PowerPing
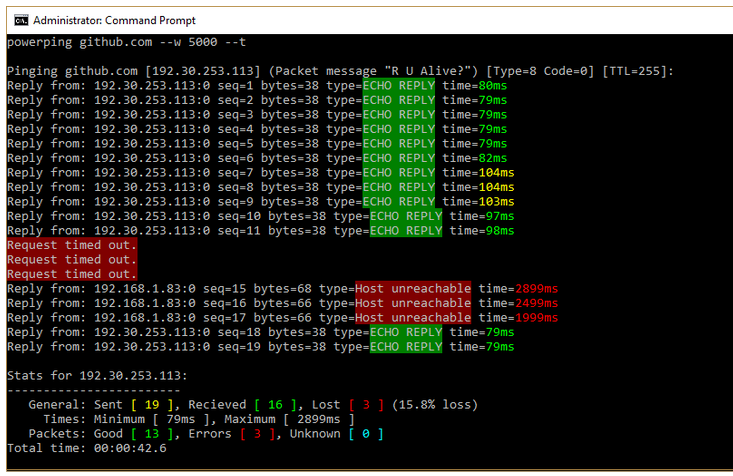
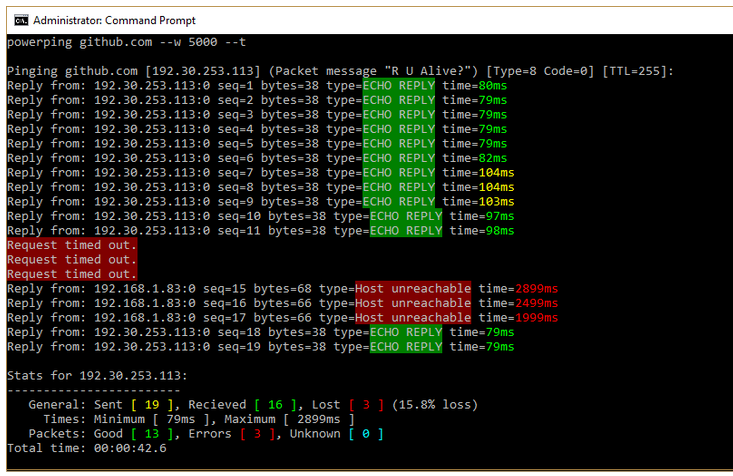
PowerPing is one of the best options for pinging and graphing the response time. The program uses the command line to ping different computers on the network and comes with some very useful tools. The command you have to use is:
powerping -g "IP address or hostname"
PingLogger
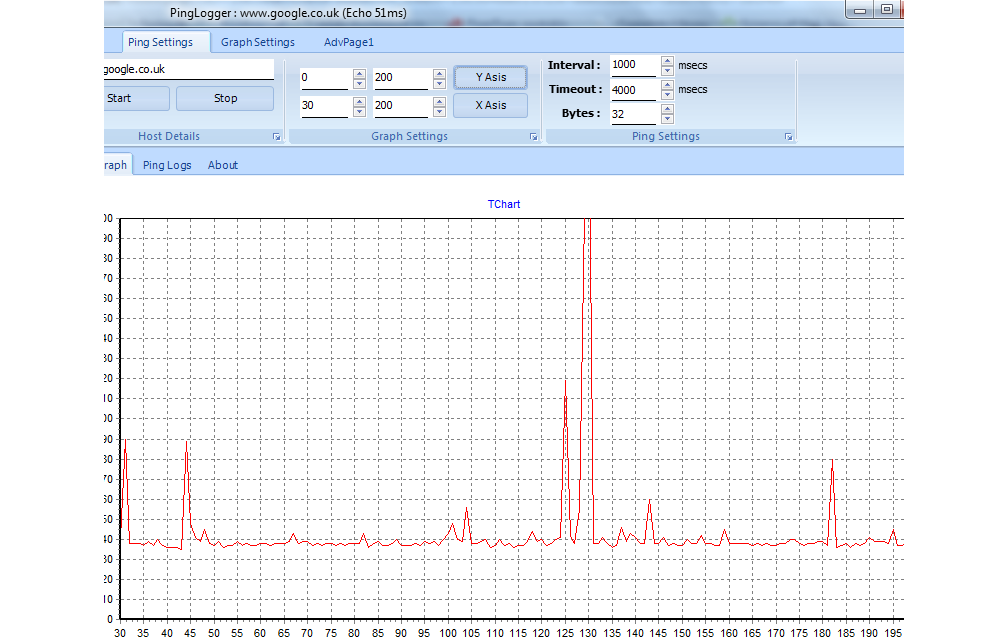
PingLogger is a GUI-based ping graphing program to graph ping response time. The environment continues to work in the background and continuously pings the target computer or device. It is very easy to use: you run the portable program and you only need to specify the IP address or domain name to start pinging.
Ping Graph
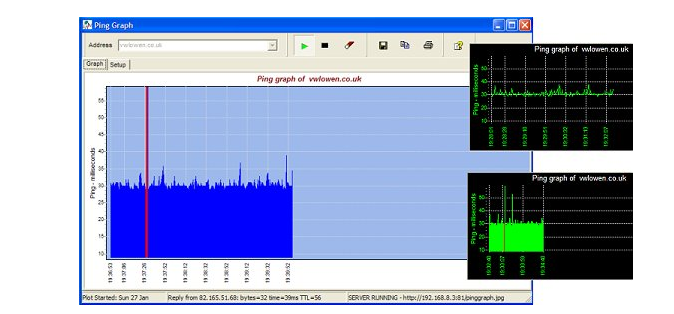
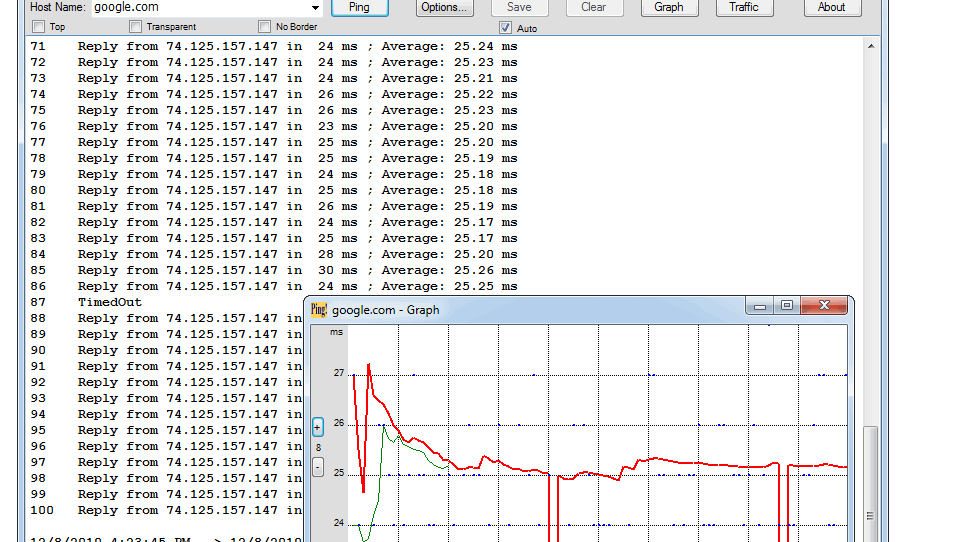
Ping Graph is an environment to graphically display ping response time. The platform is ideal for constantly pinging a device and recording statistics. Once the ping is finished, you can export the graphs in JPG format. The program comes in both portable and executable versions.
WinPing
WinPing is a simple program for performing multiple pings to different servers and displaying the graphs individually. Although from its interface you can observe the statistics and graphs of the pings, the utility does not have any option to export these services. WinPing is a portable program.
GPing
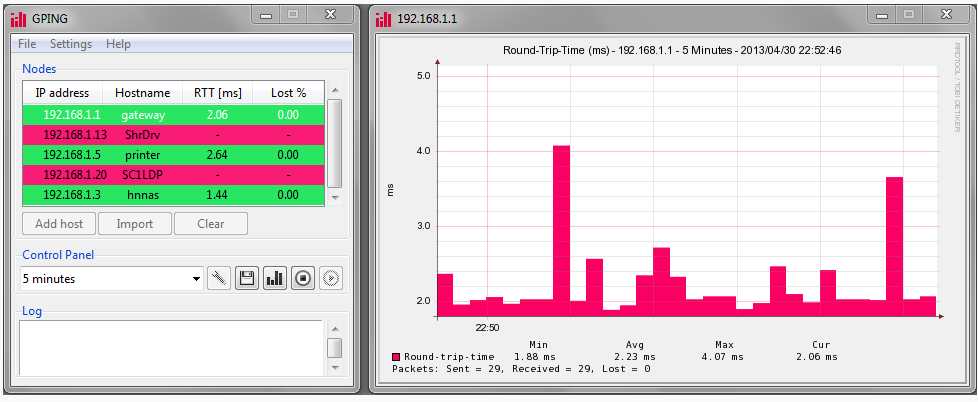
We will finish with GPing, a program that plots a histogram to indicate a ping response. One of the great advantages of the environment is the ability to download the graph as a PNG file and the statistics as a CSV file. The program is portable.
With the five programs to obtain ping graphs for multiple computers or devices, you can determine the response time between devices connected to a server.


